Get the dataData
Market size · Growth ·

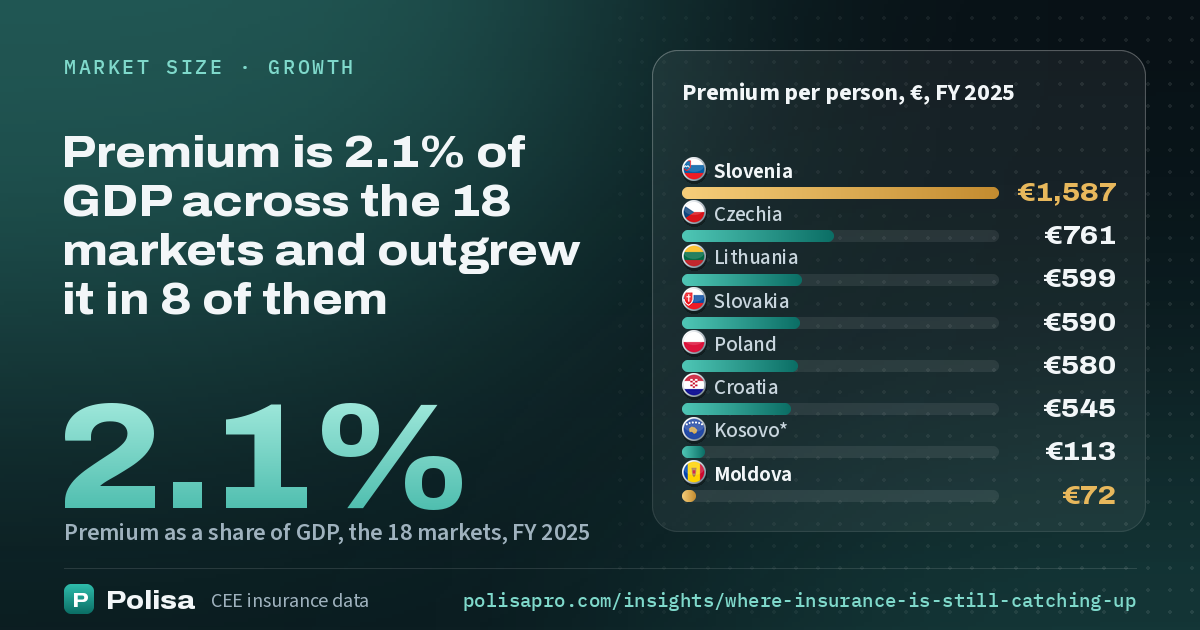
Premium is 2.1% of GDP across the 18 markets and outgrew it in 8 of them

The 18 markets wrote €56.87bn of premium in 2025, 2.1% of their GDP and €479 per person, while their GDP per person is 54% of the EU average. Scroll through the gap per person, growth since 2021 before and after inflation, where premium outgrew the economy and the outlook to 2028.

ShareLinkedInChart image (PNG)
People118.7m, 1 January 2025
PL 31%RO 16%CZ 9%HU 8%RS 6%BGSKHRBA
PL 37%RO 8%CZ 15%HU 9%RSBGSK 6%HRLTSI 6%
Premium€56.87bn, FY 2025
Each market's share of the 18 markets' people (above) and of their premium (below), in the same order. Teal: premium per person above the region's €479 (Poland, Czechia, Hungary, Slovakia, Croatia, Lithuania, Slovenia and Estonia); warm: below it, the stronger the further. Romania: 16.0% of the people, 7.6% of the premium; Slovenia: 1.8% and 5.9%. Population: Eurostat, and the statistics offices of Bosnia and Herzegovina and Kosovo*; premium: each market's supervisor or insurance association.
2.1%

of GDP: the €56.87bn of premium the 18 markets wrote in 2025; the median market 2.0%

Map: premium as a share of GDP0%4.8%

Premium, % of GDP

  1. Slovenia4.8%
  2. Czechia2.4%
  3. Slovakia2.3%
  4. Hungary2.3%
  5. Bulgaria2.3%
  6. Poland2.3%
  7. Croatia2.3%
  8. Lithuania2.0%
  9. Bosnia and Herzegovina2.0%
  10. Latvia1.9%
  11. Serbia1.8%
  12. Montenegro1.8%
  13. North Macedonia1.7%
  14. Estonia1.6%
  15. Kosovo*1.6%
  16. Romania1.1%
  17. Albania1.0%
  18. Moldova0.9%

Premium: each market's supervisor or insurance association; GDP: Eurostat (nama_10_gdp), FY 2025

22×

as much premium per person in Slovenia as in Moldova; €479 across the 18 markets, whose GDP per person is 54% of the EU average

Map: premium per person, by ratio€72€1,587

Per person · small: GDP per person, EU = 100%

  1. Slovenia80%€1,587
  2. Czechia76%€761
  3. Lithuania70%€599
  4. Slovakia60%€590
  5. Poland60%€580
  6. Croatia57%€545
  7. Hungary55%€538
  8. Estonia73%€496
  9. Latvia56%€457
  10. Bulgaria43%€417
  11. Serbia33%€249
  12. Montenegro32%€238
  13. Romania48%€228
  14. Bosnia and Herzegovina21%€176
  15. North Macedonia22%€160
  16. Albania27%€117
  17. Kosovo*17%€113
  18. Moldova18%€72

Population on 1 January 2025: Eurostat (demo_pjan); Bosnia and Herzegovina and Kosovo*: their statistics offices

14.8%

a year in Moldova since 2021, the fastest growth in local currency

Map: premium growth a year, 2021–20250%14.8%

Growth a year, 2021–2025, local currency

  1. Moldova14.8%
  2. Lithuania13.6%
  3. Bulgaria12.7%
  4. Serbia12.5%
  5. North Macedonia11.4%
  6. Romania11.3%
  7. Kosovo*11.1%
  8. Montenegro10.7%
  9. Hungary10.3%
  10. Latvia9.7%
  11. Bosnia and Herzegovina9.4%
  12. Albania8.9%
  13. Estonia8.8%
  14. Slovenia8.3%
  15. Croatia7.9%
  16. Poland6.9%
  17. Czechia6.8%
  18. Slovakia6.5%

Premium: each market's supervisor or insurance association

14/18

markets where premium grew faster than consumer prices

Map: growth a year after inflation−6%+6%

Growth a year after inflation · small: prices 2021–2025

  1. Bulgaria+30%+5.4%
  2. Kosovo*+24%+5.4%
  3. Lithuania+35%+5.4%
  4. Albania+18%+4.6%
  5. Serbia+37%+4.1%
  6. Montenegro+31%+3.4%
  7. North Macedonia+35%+3.4%
  8. Slovenia+23%+2.9%
  9. Bosnia and Herzegovina+28%+2.9%
  10. Romania+39%+2.6%
  11. Latvia+35%+1.9%
  12. Moldova+65%+1.4%
  13. Croatia+30%+1.0%
  14. Hungary+46%+0.4%
  15. Estonia+42%−0.3%
  16. Poland+34%−0.7%
  17. Czechia+35%−0.9%
  18. Slovakia+34%−1.0%

Prices: Eurostat HICP, annual averages; Moldova and Bosnia and Herzegovina: IMF, World Economic Outlook

8/18

markets where premium grew faster than nominal GDP, 2021–2025

Map: premium against GDP, change of its share−15%+15%

Premium against GDP, 2021–2025

  1. Moldova+19.1%
  2. Lithuania+11.9%
  3. Kosovo*+10.1%
  4. Latvia+8.6%
  5. North Macedonia+7.8%
  6. Estonia+5.2%
  7. Serbia+1.5%
  8. Slovenia+0.5%
  9. Albania−0.6%
  10. Bulgaria−0.9%
  11. Bosnia and Herzegovina−3.6%
  12. Czechia−4.2%
  13. Slovakia−4.2%
  14. Romania−4.9%
  15. Hungary−5.4%
  16. Montenegro−9.6%
  17. Poland−11.1%
  18. Croatia−14.9%

Nominal GDP in local currency: IMF, World Economic Outlook, October 2026

€68.0bn

premium in 2028 if it grows as fast as the economy, as in the outlook's scenario: +20% on the €56.87bn of 2025

Map: premium growth 2025–2028 in the scenario0%+32%

Premium in 2028, scenario · small: growth on 2025

  1. Poland+19%€25.3bn
  2. Czechia+19%€9.9bn
  3. Hungary+21%€6.2bn
  4. Romania+26%€5.5bn
  5. Slovenia+17%€3.9bn
  6. Slovakia+17%€3.7bn
  7. Bulgaria+16%€3.1bn
  8. Croatia+18%€2.5bn
  9. Serbia+23%€2.0bn
  10. Lithuania+16%€2.0bn
  11. Latvia+20%€1.0bn
  12. Estonia+12%€764m
  13. Bosnia and Herzegovina+17%€700m
  14. North Macedonia+14%€332m
  15. Albania+19%€330m
  16. Moldova+32%€225m
  17. Kosovo*+22%€218m
  18. Montenegro+26%€187m

Outlook scenario: IMF, World Economic Outlook, October 2026, and Polisa's estimate for 2026; euros at the latest quarter's rate

1 / 6 · Share of GDP

Premium is 2.1% of GDP

The 18 markets wrote €56.87bn of premium in 2025, 2.1% of their combined GDP. Slovenia spends the most relative to its economy, 4.8% (3.8% without Triglav's new business in Italy); Moldova (0.9%), Albania (1.0%) and Romania (1.1%) the least. The median market is at 2.0%.

2 / 6 · Per person

€1,587 per person in Slovenia, €72 in Moldova

Per person the gap is wider: Slovenians spend 22 times as much on insurance as Moldovans, while their GDP per person differs 4.4 times. Across the 18 markets premium is €479 per person; GDP per person runs from 17% of the EU average in Kosovo* to 80% in Slovenia. Slovenia's figure includes the €697m Triglav wrote in Italy, which its 2025 total counts; on Slovenian business alone it is €1,260 per person, 18 times Moldovans'.

3 / 6 · Growth

Nine markets grew 10% a year or more

Since 2021 premium grew fastest in Moldova (14.8% a year), Lithuania (13.6%) and Bulgaria (12.7%), each in its own currency, and slowest in Slovakia (6.5%), Czechia (6.8%) and Poland (6.9%). Every market grew: the slowest added 29% in four years.

4 / 6 · After inflation

After inflation, 14 of 18 grew

Consumer prices rose 18% to 65% between 2021 and 2025, so much of that growth was inflation. After it, premium grew most in Bulgaria (5.4% a year), Kosovo* (5.4%) and Lithuania (5.4%); it fell in Slovakia (−1.0%), Czechia (−0.9%), Poland (−0.7%) and Estonia (−0.3%). The 14.8% a year of Moldova, the fastest before inflation, is 1.4% after prices rose 65%.

5 / 6 · Against GDP

Faster than the economy in eight markets

From 2021 to 2025 premium grew faster than nominal GDP in eight markets, so insurance gained ground there: its share of GDP rose most in Moldova (+19.1%), Lithuania (+11.9%) and Kosovo* (+10.1%). In the other ten the economy grew faster and the share fell, most in Croatia (−14.9%), Poland (−11.1%) and Montenegro (−9.6%). Slovenia is one of them only through the €697m Triglav wrote in Italy, counted from 2025: on Slovenian business alone its premium grew 2.2% a year, more slowly than its economy.

6 / 6 · To 2028

€68.0bn in 2028 at the economy's pace

Polisa's outlook scenario lets premium grow as fast as the IMF's projected nominal GDP: the 18 markets would write €68.0bn in 2028, 20% more than in 2025. Growing with the economy keeps each market's share of GDP where it is; closing the gap takes premium growing faster than GDP, as it did in eight markets since 2021.

Income and insurance

Premium per person against GDP per person

Each coin is a market in 2025: across, its GDP per person against the EU average (Eurostat); up, its premium per person, on a scale where each step is a doubling or more. The richer markets spend more on insurance per person, and more than in proportion: the GDP per person of Slovenia is 4.4 times that of Moldova, its premium per person 22 times. A market's code opens its page.

Premium per person
€50€100€200€500€1,000€2,0000%20%40%60%80%100%HRRSCZSKPLROBGHUSIMEBAMKALXKLVLTEEMDAll 18
GDP per person, EU average = 100%

How the figures are counted: premium is the written premium of each market's insurers in 2025 from its supervisor or insurance association, as on the market pages. GDP and population are Eurostat's (the population of Bosnia and Herzegovina and Kosovo* from their statistics offices), and GDP per person is set against the EU's. Growth since 2021 is in each market's own currency, so exchange rates do not count.

Inflation is Eurostat's harmonised index of consumer prices, the average of 2025 against the average of 2021; for Moldova and Bosnia and Herzegovina, which it does not cover, average consumer prices from the IMF's World Economic Outlook. Growth against GDP sets premium growth beside nominal GDP growth from 2021 to 2025, from the same World Economic Outlook in local currency. The 2028 figure is the outlook page's scenario, not a forecast: the estimate for 2026 from the quarters published so far, then premium growing as fast as nominal GDP, in euros at the latest quarter's exchange rate.

The numbers behind it

MarketPremium% of GDPPer personGDP per person, EU = 100%Growth a yearAfter inflationAgainst GDP2028 scenario
Poland€21.16bn2.3%€58060%6.9%−0.7%−11.1%€25.3bn
Czechia€8.31bn2.4%€76176%6.8%−0.9%−4.2%€9.9bn
Hungary€5.13bn2.3%€53855%10.3%+0.4%−5.4%€6.2bn
Romania€4.34bn1.1%€22848%11.3%+2.6%−4.9%€5.5bn
Slovenia€3.38bn4.8%€1,58780%8.3%+2.9%+0.5%€3.9bn
Slovakia€3.20bn2.3%€59060%6.5%−1.0%−4.2%€3.7bn
Bulgaria€2.68bn2.3%€41743%12.7%+5.4%−0.9%€3.1bn
Croatia€2.11bn2.3%€54557%7.9%+1.0%−14.9%€2.5bn
Lithuania€1.73bn2.0%€59970%13.6%+5.4%+11.9%€2.0bn
Serbia€1.63bn1.8%€24933%12.5%+4.1%+1.5%€2.0bn
Latvia€850m1.9%€45756%9.7%+1.9%+8.6%€1.0bn
Estonia€680m1.6%€49673%8.8%−0.3%+5.2%€764m
Bosnia and Herzegovina€600m2.0%€17621%9.4%+2.9%*−3.6%€700m
North Macedonia€291m1.7%€16022%11.4%+3.4%+7.8%€332m
Albania€277m1.0%€11727%8.9%+4.6%−0.6%€330m
Kosovo*€179m1.6%€11317%11.1%+5.4%+10.1%€218m
Moldova€171m0.9%€7218%14.8%+1.4%*+19.1%€225m
Montenegro€148m1.8%€23832%10.7%+3.4%−9.6%€187m

Premium written in 2025, from each market's supervisor or insurance association; GDP and population: Eurostat (population of Bosnia and Herzegovina and Kosovo*: their statistics offices). GDP per person: in euros at current prices against the EU's, EU = 100%, without purchasing-power adjustment. Growth a year: 2021–2025 in local currency. After inflation: deflated by Eurostat's HICP (annual averages); * Moldova and Bosnia and Herzegovina, which Eurostat does not cover: the IMF's average consumer prices. Against GDP: premium growth against nominal GDP growth 2021–2025 (IMF, local currency), the change in premium's share of GDP. 2028 scenario: the outlook page's, premium growing with the IMF's projected nominal GDP, in euros at the latest quarter's rate.

More insights

Pages behind it

When the figures change

Every data update is listed with its date, newest first: new figures, corrections and what they changed.

What changed
CiteCite this pageThe reference in APA style and as BibTeX, each with a copy button, and the terms of reuse

Polisa compiles the figures; the original sources are named on this page and on the method page.

APA

Polisa. (2026). Premium is 2.1% of GDP across the 18 markets and outgrew it in 8 of them [Data version 2026-11-11.13378f]. Retrieved November 11, 2026, from https://polisapro.com/insights/where-insurance-is-still-catching-up

BibTeXShow entry
Entry for a .bib file
@misc{polisa_insights_where_insurance_is_still_catching_up_2026,
  author       = {{Polisa}},
  title        = {Premium is 2.1% of GDP across the 18 markets and outgrew it in 8 of them},
  year         = {2026},
  version      = {2026-11-11.13378f},
  howpublished = {\url{https://polisapro.com/insights/where-insurance-is-still-catching-up}},
  note         = {Accessed 11 November 2026}
}

Reuse: Polisa's compilation CC BY 4.0 · source data under each publisher's terms, see Method.