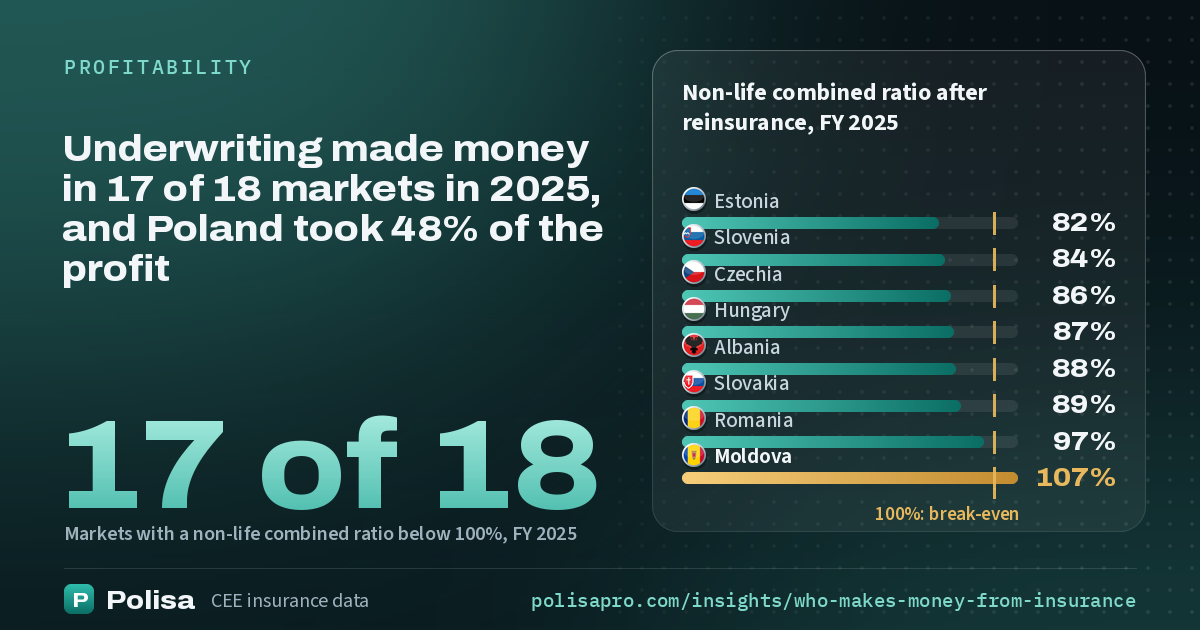
How the figures are counted: the combined ratio is claims and costs over earned premium in the non-life business, as on the market pages: after reinsurance where the insurers whose reports give the net figures write half of the market's non-life premium, else gross. It comes from template S.05.01 of each insurer's solvency report in the Solvency II markets and from the supervisors' tables elsewhere, so it leaves out investment income.
Underwriting and investments are those of the non-life insurers (life under a fifth of their premium) with an investment result, as on the performance page: underwriting earned (100% minus the combined ratio) of their earned premium, and the investment result is the one in each insurer's report, a parent's dividends from its own life insurer taken off. Return on equity is net profit over average equity; net profit adds up the insurers' accounts, a dividend between two insurers of the same market counted once.
The numbers behind it
| Market | Combined ratio 2025 | Years below 100% | Underwriting €m | Investments €m | From underwriting | Return on equity | Net profit |
|---|---|---|---|---|---|---|---|
| Poland | 92.2% | 5 of 5 | 947.2 | 1290.2 | 42% | 19.2% | €2.44bn |
| Czechia | 86.2% | 5 of 5 | 170.5 | 104.0 | 62% | 22.0% | €803m |
| Hungary | 87.0% | 5 of 5 | 22.1 | 21.0 | 51% | 24.4% | €281m |
| Romania | 96.7% | 4 of 5 | 84.0 | 230.1 | 27% | 20.1% | €283m |
| Slovenia | 84.1% | 4 of 5 | 195.9 | 85.0 | 70% | 11.9% | €239m |
| Slovakia | 89.2% | 5 of 5 | 2.2 | 20.0 | 10% | — | €222m |
| Bulgaria | 92.9% | 5 of 5 | — | — | — | — | €178m |
| Croatia | 95.9% | 5 of 5 | 38.5 | 97.3 | 28% | 7.1% | €137m |
| Lithuania | 89.6% | 5 of 5 | 93.0 | 29.3 | 76% | — | €158m |
| Serbia | 90.5% | 5 of 5 | 65.0 | 47.2 | 58% | — | €125m |
| Latvia | 92.1% | 5 of 5 | 51.7 | 14.6 | 78% | — | €71m |
| Estonia | 82.3% | 5 of 5 | 67.7 | 14.9 | 82% | — | €77m |
| Bosnia and Herzegovina | 95.0% | 5 of 5 | — | — | — | — | €43m |
| North Macedonia | 96.7% | 2 of 5 | 5.8 | 8.8 | 40% | — | €19m |
| Albania | 87.7% | 5 of 5 | 22.4 | 6.7 | 77% | — | €34m |
| Kosovo* | 93.5% | 4 of 5 | 7.9 | 5.0 | 61% | — | €14m |
| Moldova | 107.4% | 3 of 5 | −7.1 | 6.6 | 0% | — | €3.8m |
| Montenegro | 96.0% | 5 of 5 | 3.5 | 4.9 | 42% | — | €12m |
Combined ratio: claims and costs over earned premium in the non-life business, after reinsurance where the insurers' figures allow (else gross, marked), as on the market pages; below 100% is a profit on underwriting. Years below 100%: 2021–2025. Underwriting and investments: the non-life insurers (life under a fifth of premium) with an investment result, as on the performance page, shown where they write half of those insurers' premium. Return on equity: net profit over average equity, Solvency II markets where the insurers with both figures write 85% of premium. Net profit: as reported for 2025, a dividend between insurers of the same market counted once.
More insights
Hungarian insurers earn the highest return on equity in the region, 24%, Croatian insurers about 7%
24.4%Hungarian insurers returned 24.4% on average equity in 2025, Czech insurers 22.0% and Romanian insurers 20.1%. Polish insurers earned 19.2%, up from 10.4% in 2021. In Croatia the return has stayed between 6% and 8% in every year since 2021.
40 of 64 large non-life insurers in the EU markets made an underwriting profit after reinsurance in each of the last five years
40 of 64Among insurers in the eleven Solvency II markets with at least €50m of non-life earned premium in every year from 2021 to 2025, 40 kept their combined ratio after reinsurance below 100% each year. All of them in Czechia, Bulgaria, Slovenia and Latvia did; in Slovakia, one of six.
Life insurers, most of them Polish, earn the highest returns in the region
67%Return on equity of NN Asigurări de Viață in 2025; Erste Allianz Życie, PKO Życie, Allianz Życie and Nationale-Nederlanden also exceed 45%. Poland makes €2.4bn of the €5.14bn of net profit reported for 2025 by insurers writing 95% of the region's premium.
Pages behind it
When the figures change
Every data update is listed with its date, newest first: new figures, corrections and what they changed.
What changedCiteCite this pageThe reference in APA style and as BibTeX, each with a copy button, and the terms of reuse
Polisa compiles the figures; the original sources are named on this page and on the method page.
Polisa. (2026). Underwriting made money in 17 of 18 markets in 2025, and Poland took 48% of the profit [Data version 2026-11-11.13378f]. Retrieved November 11, 2026, from https://polisapro.com/insights/who-makes-money-from-insurance
BibTeXShow entry
@misc{polisa_insights_who_makes_money_from_insurance_2026,
  author       = {{Polisa}},
  title        = {Underwriting made money in 17 of 18 markets in 2025, and Poland took 48% of the profit},
  year         = {2026},
  version      = {2026-11-11.13378f},
  howpublished = {\url{https://polisapro.com/insights/who-makes-money-from-insurance}},
  note         = {Accessed 11 November 2026}
}
Reuse: Polisa's compilation CC BY 4.0 · source data under each publisher's terms, see Method.